
Student name
Capella University
MBA-FPX5008 Applied Business Analytics
Professor Name
Submission Date
Presenting Data Analysis Results Effectively
Slide 1:
Good morning, my name is _______, and I am here to provide you with an in-depth look at The Coca-Cola Company’s stock for the past decade.
Slide 2:
Effective communication of results of analysis is required to communicate results of data analysis successfully; providing multiple audiences with clear insights to be acted upon from complex findings will require a variety of methods of communicating through the use of visual tools (charts, graphs, and tables) that help clearly show patterns and/or these trends. When presenting analytical results, the presentation of data (both descriptive and narrative) increases the effectiveness of communicating the impact that decisions made will have on others. The effective sharing of results from analyses greatly increases both the value added from and the impact of any business analysis.
Company Context
Slide 3:
When you get insight into a company’s history, you should have background information on the financial results that they have delivered, and how well they have done as a company in the market. Grouped together in 1892, in Atlanta, Georgia, The Coca-Cola Company is one of the world’s leading beverage companies (The Coca-Cola Company, 2025). The Coca-Cola Company has more than 200 different products, including Coke, Sprite, and Dasani, and sells products in more than 200 countries (Hong & Luo, 2024). By having a background knowledge of the company, analysts will be able to make successful recommendations on whether to invest in the company or not.
The stock performance data are influenced by the nature of the business environment, which is competitive. As well, Coca-Cola faces competition from the other two giant non-alcoholic beverages companies, PepsiCo and Keurig Dr. Pepper, in the global market (Huse et al., 2022), and the sales of PepsiCo surpass those of Coca-Cola; it still manages to stay the top player in the market thanks to the specialization of its brands and efficiency (Hong & Luo, 2024). So it’s crucial to consider what the competition is like when making appropriate inferences on the stock performance analysis.
Graphical Interpretations
Slide 4:
High Stock Price Trend
Figure 1
High Stock Price Trend
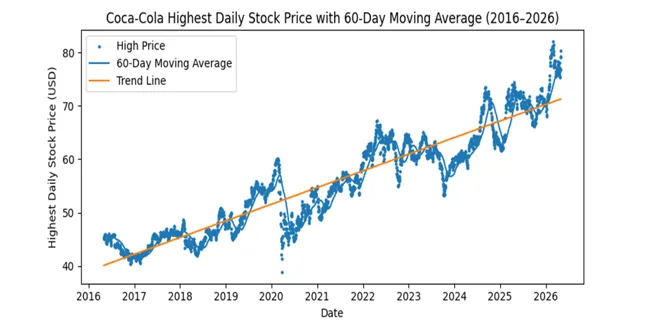
Having the stock price change over a large time frame gives an idea of the extent to which the firm’s stock still enjoys the trust of the market and how the firm has performed financially. The share price of Coca-Cola has been steadily rising for the past decade (2016-2026), with its highest price ever recorded at Nasdaq, 2026a. There is still an upward trend in the number of the highest daily stock prices in the 60-day moving average, which shows that there is still strong positive momentum despite the fact that the fluctuation caused by the ups and downs of the short-term market does not seem to be significant (Song et al., 2023). Like the other day’s best stocks, Coca-Cola has demonstrated that its best daily trades share a common characteristic: they’re strong stocks, suggesting that they are popular with investors and have strong growth prospects.
Slide 5:
Competitor & Industry Stock Graph (KO vs PEP vs KDP)
Figure 2
Competitor & Industry Stock Graph (KO vs PEP vs KDP)
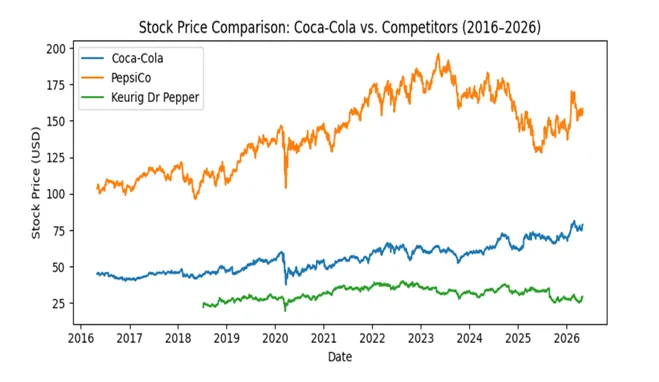
Analyzing the different companies’ relative stock price trends over time in a graphical format will show the different behaviours of the relative stock price trend of the different companies and how it relates to the individual company’s stock price. As PepsiCo has traditionally enjoyed high prices with minimal fluctuations over the past decade, it has multiple income streams (Liu, 2023). In the case of Coca-Cola’s business, it has shown a trend of steady revenue/income growth in its operation, which may be attributed to its strong customer loyalty and the operation of the business being efficient (Hong & Luo, 2023). A comparison of the companies’ stock prices at an industry level will give the investors the time to analyze which of the companies have provided them with steady value over time.
Slide 6:
Competitor Comparison Table (KO vs PEP vs KDP)
Table 1
Competitor Comparison Table (KO vs PEP vs KDP)
Metric | Coca-Cola | PepsiCo | Keurig Dr Pepper |
Industry | Nonalcoholic Beverages | Food & Beverages | Nonalcoholic Beverages |
Estimated Global Beverage Market Share | 43% | 25% | 7% |
Total Sales (2025) | $47 Billion | $92 Billion | $15 Billion |
Number of Employees | 79,000 | 318,000 | 29,000 |
Total Assets (2025) | $106 Billion | $103 Billion | $53 Billion |
Primary Business Model | Beverage Manufacturing & Distribution | Food and Beverage Manufacturing | Beverage Manufacturing & Distribution |
You’ll get an idea of the market positioning of your Company relative to the competition, as well as their financial strength, by analyzing competitors. In the global beverage market, about 43% of beverage sales were generated via Coca-Cola products, while Keurig Dr Pepper (trading on Nasdaq, 2026b) generated sales of just about 7%. For the total global sales, for the full line of beverages and food, PepsiCo accounted for US$ 92 billion in total sales for FY2025, while Coca-Cola’s total revenue for all beverages and Food for the same period (trading on Nasdaq, 2025) came to about US$ 47 billion. The competitor comparative analysis is delivered through tables, allowing the shareholders of each Company to perform a relative analysis of each Company based on the different variable types through a relative strength/weakness analysis.
Slide 7:
Descriptive Statistics: Daily Closing Prices
Table 2
Descriptive Statistics: Daily Closing Prices
Statistic | Value |
Mean | 58.73 |
Median | 58.11 |
Mode | 43.12 |
Standard Deviation | 8.64 |
Variance | 74.65 |
Range | 35.72 |
Minimum | 38.45 |
Maximum | 74.17 |
Count | 2,500+ |
The past ten years have seen relatively stable performance of Coca-Cola’s stock. The day’s average price of the Coca-Cola stock was $58.73, and the middle price value in the price series (median) was $58.11 (Nasdaq, 2026a). From the last decade of yearly observations, Coca-Cola’s stock has exhibited outstanding consistency in its yearly performance, which has a low level of investment risk as characterized by a low level of price volatility during the year. Lastly, the standard deviation of all Coca-Cola stocks equaled to $8.64, which confirms our argument that over the past decade stocking Coca-Cola is not as risky as the stocks of other similar companies.
Slide 8:
Descriptive Statistics: Daily Trading Volume
Table 3
Descriptive Statistics: Daily Trading Volume
Statistic | Value |
Mean | 15,400,000 |
Median | 14,200,000 |
Mode | N/A |
Standard Deviation | 5,800,000 |
Variance | 3.36E+13 |
Range | 38,000,000 |
Minimum | 4,000,000 |
Maximum | 42,000,000 |
Count | 2,500+ |
Every company in the stock exchange provides information on trading volume (daily, weekly) for each company, so that the market players can easily measure their exposure to the stock market, and the overall stock market is also easily measurable in terms of the trading volume of all companies. The share volume traded over the last decade shows that the trading volume of Coca-Cola’s stock is ~15.4 million shares per day, which is high (Nasdaq 2026a). That average trading volume has a relatively high standard deviation as well, 5.8 million, indicating that there is a high level of volatility, which means that it is possible that the trading volume of Coca-Cola’s stock may spike at times, due to the influence of either earnings or general market movers (Jin 2022). Coca-Cola also has a high average trading volume, and has also historically had a high liquidity – hence Coca-Cola is the most bought/sold stock in the beverage sector.
Slide 9:
Analyst Opinions and Market Consensus
Other stock analysts’ notes on the stock will provide a broader picture of the stock’s performance as a whole, which will help investors to have a better overall understanding of Coca-Cola. Coca-Cola’s primary revenue sources include its pricing, cost control, and distribution strategies around the world (Song et al., 2023). Also, suppliers of non-calorie Coca-Cola beverages are a development that further demonstrates the company’s volatility in relation to consumers’ tastes (Coca-Cola, 2024), according to other analysts. Further, Coke’s blend of the various analysts’ scores reinforces the certainty that the company is a generally good investment.
Application of Data Analysis to Business Context
Slide 10:
The high and low levels of the stock price of Coca-Cola show that there is still investor confidence in the company’s growth potential. This is backed by an upward trend in the stock prices of the company (both the low and high prices) over the past 7 years (Nasdaq, 2023a). The low variance of the company also indicates that the company will offer stable returns to its investors (Song et al., 2023). The statistics will also give concrete evidence for Coca-Cola’s position as it is able to draw stable returns from its investments and can develop long-term partnerships with risk-averse investors. If data and analytical results are taken into the business decision-making process, all future business decisions, as well as business strategies, will use data and analytical results to help them achieve their goal.
Stock performance data can be utilized by business leaders to enhance investment decision-making, establish partner connections, and expand the business. Coca-Cola’s liquidity, which is evident in the average number of shares traded daily (15.4 million), provides a good impression of being an attractive and reliable investment (Nasdaq, 2026a). Coca-Cola has shown competitiveness above all the competitors, including PepsiCo, Keurig Dr Pepper, and has proven its strength as well as how well it stands in the beverage industry in the world. (Huse et al., 2022). By leveraging a data-driven method, businesses can make well-informed choices and ensure they have sustainable and profitable results through rigorous analysis.
Final Recommendation and Action Plan
Slide 11:
Data-driven recommendations can be used as a foundation for organizations to make informed decisions, giving them a fact-based approach to successful strategic planning. Based on the overall trend of the company’s shares, Coca-Cola’s shares have increased in value over the last 10 years, making it a suitable choice for long-term investment (Nasdaq, 2026a). The company still accounts for 43% of the global beverage market and, as a competent performer, has consistently branded itself and has proved itself to be an efficient partner to engage in business relationships. Thus, when organizations are considering the possibility of investing in and/or partnering with Coca-Cola, they should consider its strong track record of good financials.
Based on the competitor analysis, it has been proven that companies have to make Coca-Cola their No.1 supplier of non-alcoholic drinks. Even though PepsiCo has higher total revenue, the fact that Coca-Cola is specialized on the beverage industry allows it to maintain a higher continuity of brands compared to PepsiCo and therefore allows it to optimize operational efficiency (Hong & Luo, 2024). Furthermore, Keurig Dr Pepper has only a 7% share of the limited market, which further illustrates the superior option in the long run to expand their operations as Coca-Cola in a potential strategic alliance. This analysis contributes to the conclusion that business leaders have plenty of room for new avenues in the beverage industry to pursue, through data.
Discussion and Closing Remarks
Slide 12:
In this presentation, we have shown you the result of our thorough ten‐year stock performance analysis of The Coca‐Cola Company; you can see from this data, graphics, and statistics that the results of this analysis can help you in making well-informed business or investment decisions, no matter what level of the organization you are in. We appreciate your questions, views, and reflections on these data; all contribute to a greater understanding of the data that we have presented today. We hope that your time, attention, and engagement in this presentation were worthwhile.
