
Student name
Capella University
MBA-FPX5008 Applied Business Analytics
Professor Name
Submission Date
Presenting Data Analysis Results Effectively
Slide 1:
Hello, I’m ________, and today I’m going to be analyzing the performance of NVIDIA Corporation’s stock over the last decade, and I’m going to be using a full data-driven approach to detailing the performance and strategic business implications of the stock.
Slide 2:
Reporting back the results of data analysis well will assist in making business decisions to various audiences and demystify the complexity of the data. To display NVIDIA’s stock price data, which contains more than 2,500 observations, over a decade and clearly illustrate the stock price’s exponential growth, it is essential to have clear visuals that communicate this data effectively. When sharing data with non-technical stakeholders, well-designed, visually appealing graphics can show trends in data that would otherwise not be clear if relying on raw statistics alone, according to Hull (2022). A visualization of the descriptive statistics of NVIDIA’s mean closing price for this period ($39.67) and its standard deviation ($54.94) will help make those descriptive statistics into actionable strategic insights.
Company Context
Slide 3:
A firm’s cost of capital is very dependent on the context under which the firm was created—a fact that can have a significant impact on a wide strategic evaluation from which stock performance can be evaluated in comparison with its similar competitors. Established in 1993, NVIDIA, a leading global innovator in artificial intelligence (AI) system architecture and infrastructure, has evolved from the video game graphics chip industry into a company with a global footprint. NVIDIA was founded in 1993 and has become the world’s global leader in the development of artificial intelligence system architecture and infrastructure (NVIDIA, 2026). As of FY24, NVIDIA’s market share of the total global AI graphics processing unit (GPU) circuit microprocessor (MPU) market is estimated to be ~86-92%, and it is estimated to generate ~$60.9 billion in revenues (Vendrell-Herrero et al., 2025). A deep dive into NVIDIA stock performance data, compared against its historical performance, can help analysts and decision-makers gain a better understanding of the company’s stock performance.
The business strategy, in which a company operates, can offer useful ideas on what factors are affecting its business performance and how it stands in the business world. With the strategic transformation of its business and step into the world of Artificial Intelligence infrastructure, cloud computing, and data centre technology, NVIDIA is in a far better competitive position compared to AMD, which accounts for only 8% – 10% of the market for GPUs (Nasdaq, 2026). The boom of demand for AI hardware after 2023 had instant and direct consequences on the share price of NVIDIA, climbing from below 40$ to a maximum value of 207.04$ and bringing an unprecedented level of trust in investing in NVIDIA (Vendrell-Herrero et al, 2025). Putting these changes in the context of the semiconductor industry helps all stakeholders fully understand the implications these changes have on their businesses, given the data analysis provided.
Graphical Interpretations
Slide 4:
Comparative Table (NVIDIA vs. AMD vs. Intel)
Table 1
Comparative Table (NVIDIA vs. AMD vs. Intel)
Variable | NVIDIA | AMD | Intel |
AI/Data-Center Market Share | 86–92% (AI GPU) | 8–10% (GPU/AI) | ~70% (CPU) |
Total Revenue (2024) | $60.9 billion (FY2024) | $25.8 billion | $54.2 billion |
Employees | ~29,600 | ~26,000 | ~124,800 |
Total Assets | ~$65 billion | ~$67 billion | ~$191 billion |
Sources: Vendrell-Herrero et al. (2025); Nasdaq (2025, 2026); NVIDIA (2026)
Comparative data from various organizational parameters is analyzed on this benchmark performance, and stakeholders can be provided an unbiased platform over which they can evaluate the competency of their organization in comparison with other organizations. As of the end of February 2024, for instance, NVIDIA commands ~86-92% of the global AI GPU market and generates $60.9 billion of revenues during FY2024 as compared to AMD with $25.8 billion of revenues and Intel with $54.2 billion (Vendrell-Herrero et al., 2025). Nevertheless, even though Intel has an employee base nearly 5x larger than NVIDIA’s (124,800 vs. 25,000) as well as total assets of approximately $191 billion (also more than 5x NVIDIA), Intel’s growth rate in this rapidly growing and evolving technology area has been slower than AMD and NVIDIA (Nasdaq, 2025). Finally, the comparative analysis using more than a single variable provides the corporate leadership with an empirical basis to make decisions on investment, partnerships, and a comparison with the competition.
Slide 5:
Competitor and Industry Graph (NVIDIA vs. AMD vs. Intel Stock Price 2016–2026)
Figure 2
Competitor and Industry Graph (NVIDIA vs. AMD vs. Intel Stock Price 2016–2026)
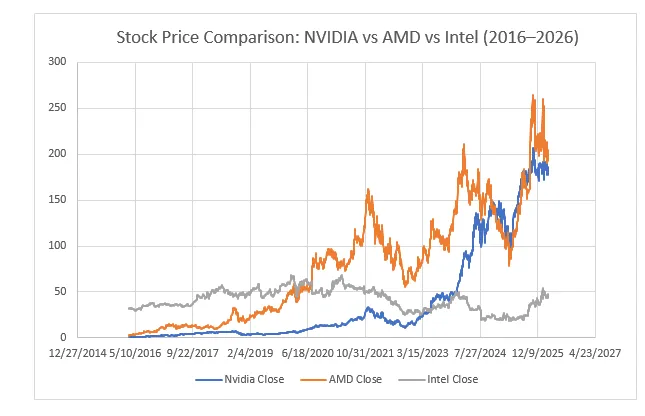
It’s important to see how a company’s stock has fared relative to its counterparts over a period of time, as this will give you an idea of the speed of the market and if consumers trust the market in general. Specifically, at its highest valuation in 2023, NVIDIA’s stock price was as high as $207.04 compared to Intel, which was in a considerably lower range and was fairly stable (Nasdaq). Meanwhile, although AMD’s stock price rose, it wasn’t by much, proving that the demand for AI had a significant impact on just NVIDIA’s market value in comparison to its semiconductor rivals (AlShekh et al.). These competitor performance graphics will allow organizations to evaluate their relative performance in the industry to see where strategic opportunities lie, as well as accurately understand their own competitive advantage.
Slide 6:
Descriptive Statistics – Closing Price Distribution
Table 1
Descriptive Statistics – Closing Price Distribution
Close/Last | |
Mean | 39.66617276 |
Standard Error | 1.095485345 |
Median | 13.465 |
Mode | 177.82 |
Standard Deviation | 54.93834431 |
Sample Variance | 3018.221675 |
Kurtosis | 1.103967289 |
Skewness | 1.578617793 |
Range | 206.2365 |
Minimum | 0.8035 |
Maximum | 207.04 |
Sum | 99760.4245 |
Count | 2515 |
Descriptive Statistics will help you to recognize movement in stocks both numerically and visually (graphically), which will enable you to make a data-based decision in business. The total population means share closing price ($39.67) is then compared to the median ($13.47) share closing price of the NVIDIA common stock for the 2500 observations to check that they are significantly different; which gives a positive skew (1.58) for the distribution of share prices in the sample (Nasdaq, 2026). Besides this, there is a significant deviation of the mean price from the median price of NVIDIA during the last part of our period of study (essentially post 2023), which shows that most of the price rise the company experienced in the 2017 to 2027 period was during the final segment (Al-Khasawneh et al., 2024). Upon knowing these “distributional characteristics” of these sample statistics, executives will be able to distinguish between short-term, less meaningful, movements in the share price and the real creation of wealth to the shareholder, in the long term.
Slide 7:
Descriptive Statistics – Trading Volume Distribution
Table 2
Descriptive Statistics – Trading Volume Distribution
Volume | |
Mean | 453730167 |
Standard Error | 5148357.017 |
Median | 406083200 |
Mode | 463839200 |
Standard Deviation | 258188949.5 |
Sample Variance | 6.66615E+16 |
Kurtosis | 17.53164796 |
Skewness | 2.755094445 |
Range | 3622603050 |
Minimum | 65528550 |
Maximum | 3688131600 |
Sum | 1.14113E+12 |
Count | 2515 |
Trader Volume per Price is analyzed together, so that you get a better overview of the trader’s behaviour in comparison to other market participants and how liquid the market is over time. For example, the average number of shares per day traded of NVIDIA on the Nasdaq in 2026 is ~453 million per day and ~258 million per day (standard deviation). Both of these statistics reveal there’s plenty of liquidity, and that the volume of NVIDIA shares trading each day has a lot of volatility. Moreover, the high kurtosis (17.53) and high skew (2.75) suggest that there is a high chance of high volumes of trades in the company’s Ethereum tokens that are linked to significant news regarding the company’s advancements in the field of artificial intelligence (AI) or the quarterly earnings releases (Bryzgalova et al., 2023). In sum, attributes of NVIDIA’s volume would indicate that it has a large market share, and thus, as a potential investment choice, should be looked into.
Slide 8:
Summary of Other Analysts’ Comments
Independent experts’ insights on the application of internal data analytics can enhance the credibility of the analysis that the internal analysts perform, and serve as an extra indication of the accuracy of the stock trend identified by the internal analysts over historical data. Vendrell-Herrero et al. (2025) credit NVIDIA’s remarkable scaling capabilities for its role in maintaining its leadership in the high-performance computing (HPC) market. Furthermore, Bonelli (2025) says that his results reveal that throughout the investment sample periods from 2015 to 2023, NVIDIA has consistently maintained its position in the market to forecast a rise in its stock prices, and concludes that NVIDIA’s situation is better compared with Intel and AMD from the point of view of financial measures. Based on this, all the analyses mentioned in this paper seem to validate the fact that NVIDIA, from a financial and statistical analysis viewpoint, is a good investment opportunity.
Application of Data Analysis to Business Context
Slide 9:
Organizations should consider how to move from the outcome of analyzing their data to making it actionable in their business – this will enable informed decision-making across the whole organization for strategic initiatives. The 10-year pattern of NVIDIA’s stock price growth, from a low of $0.80 to $207.04, is an indicator of the immense long-term value creation that NVIDIA can deliver as an investment opportunity and/or as a partner to other businesses (Nasdaq, 2026). This can also be known from NVIDIA’s dominance of the AI GPU market (86-92%) and their bigger revenues in FY 2024 ($60.9 billion), which shows that investing in AI infrastructure returns much better monetarily, as compared to other investments (Vendrell-Herrero et al., 2025). Leveraging these same analytical insights in an organization/business environment allows organizational leaders to make more informed decisions and prioritize the development of partnerships, technology investments, and other resource allocation strategies with greater confidence, knowing they are based on insight from AI.
Slide 10:
Knowing how analytics results connect to the business results makes it possible to serve information as analytic, actionable, and valuable to all the company’s stakeholders. According to Nasdaq (2026), NVIDIA’s daily share volume of 453 million shares is the average, based on the last three months. Hence, the company has a good Liquid Position in the Market. So, companies that are considering taking long-term equity stakes would have low risks, as NVIDIA’s stock price is volatile by +55.27 if we look at the price of a single stock. But despite this stock price volatility, there is a trend in the stock price change that has been consistently positive, given the strong growth in the demand for infrastructure in A.I. Armed with these findings, organizations’ decision makers can not only view investing in NVIDIA as an important growth opportunity, but as a valuable technology partnership as well.
Final Recommendation and Action Plan
Slide 11:
Data-driven recommendations, given with a sound statistical analysis (as well as graphical analysis), provide an organization with the best chance to have a successful strategic business plan. The stock price of NVIDIA is higher compared to its competitor’s stock price, as indicated by the competitor comparison graph, which indicates that the market momentum of NVIDIA is higher than its competitors, with the time period as both of them have a much lower stock price in comparison to NVIDIA, which is $207.04 (Bonelli, 2025). Moreover, descriptive statistics also support this suggestion as NVIDIA’s trading volume is 453 million shares per day on average during the analyzed period, suggesting high levels of liquidity and investors’ trust in NVIDIA’s shares in the period of analysis (Bryzgalova et al., 2023). All of these findings from a visual and graphical analysis point of view strongly support that the organization leaders should consider investing in NVIDIA as a strategic (long-term) investment in addition to business partnerships.
Graphical evidence of business recommendations helps to convert the analytical outcomes to business recommendations and makes it easier to see if it provides measurable value to the organization or only academic observations as a result of the analytical work. For instance, the trading volume histogram perfectly shows the extreme kurtosis (17.53) that has been caused by the way big news on AI is breaking, with investors reacting to it in similar ways, creating favorable trading opportunities for engaging with the businesses and looking to buy in on the equities (Nasdaq, 2026). Similarly, the closing price distribution shows that there is a high positive skewness (1.58), meaning that the most spectacular growth rates of NVIDIA have happened in the most recent years, the period during which an investment strategy needs to be created (Vendrell-Herrero et al., 2025). So, sound business recommendations should be based on empirical graphical evidence – the strategic priorities used by the organization should be responsive to the market realities, using a proven track record rather than making speculations.
Discussion and Closing Remarks
Slide 12:
This dialogue can occur immediately after presenting the facts and create an opportunity for both parties (the presenters and the audience) to collaborate on how best to take advantage of the analytical information throughout their respective organizations as they strive to use this analytics in their strategic decision making, be it investment opportunities or establishing partnership opportunities. Based on the data that was presented today (i.e., stock prices of NVIDIA over the last 10 years, how to price their competitors, and how the volumes of each of those competitors’ trades have changed), the stakeholders that attended this presentation can also have a discussion regarding constructive input in relation to developing future directions for shareholder value creation through strategic investments or partnerships. This will allow all stakeholders to ask questions, offer perspectives, and add additional ideas for ongoing analysis of the same data presented, all for the sake of maximizing the use of that data when making data-driven business decisions, and ultimately improving the overall quality of the data used for those consequential decisions. Thank you for your participation, time, attention, and consideration in this presentation.
