
Student name
Capella University
MBA-FPX5008 Applied Business Analytics
Professor Name
Submission date
Using Analytical Techniques to Add Meaning to Data
Business analytics are the processes that are involved in converting historical data into information for decision-making. In the securities market, it has come to a point where the decisions of the investments are made through various analytical methods like visual representation, descriptive statistics, and comparing the performance of the company. Historical stock performance analysis can be used to gain insights into many facets of the company’s financial condition and how it performs over time, including its sustainability, competitiveness, and growth capacity (He & Yang, 2024). The historical analysis helps in determining the effects of the environment and competition on the business’s performance.
This report aims to try to assess the performance of the Coca-Cola Company’s stock over the past 10 years fully. It will be carried out to evaluate the trend, stability, and sustainability of the business performance of the beverage industry. For the stock performance analysis, the daily stock information will be analyzed for 10 years (2016-2026). It will provide analyses of various parameters like opening price, day’s high price, day’s low price, closing price, and total number of shares traded. The report also analyzes the performance of the company’s stocks as compared to its competitors, PepsiCo and Keurig Dr Pepper, so as to analyze its competitive strength in the non-alcoholic beverages industry. The results should assist in informing investment and partnership decision-making processes, which will be supported by business and financial analytics.
Company Background
Incorporated in 1892 in the City of Atlanta, Georgia, Coca-Cola is one of the world’s top beverage companies. The principal products produced by Coca-Cola include carbonated beverages, bottled water, sports beverages, juice beverages, tea/coffee beverages, and energy beverages. The Coca-Cola Company’s purpose is to inspire moments of optimism and happiness through its products and programs in the world. Some of their activities consist of ensuring that their products are high quality and, at the same time, benefit the environment along with the surrounding communities. Carter’s vision for the company is to “create a more sustainable future for everyone” by bringing to life their beloved brands and drinks. The company’s values are leadership, integrity, accountability, diversity, and sustainability; all of which have played a key role in boosting its credentials globally.
Firm Coca-Cola is an example of a platform that is only present in one industry. There are a variety of businesses that are in multiple industries. But, Coca-Cola has its businesses and strategies limited to one specific industry – beverages. By targeting a single industry, it is appropriate for competitor and financial analysis because all the revenue streams and business strategies are based on one industry. It offers over 200 drinks, such as Coke, Sprite, Fanta, Dasani, Minute Maid, and PowerAde, in the entire world. The company’s large bottling and distribution network enables it to have a presence in over 200 countries around the world.
The Company’s strength lies in its geographical footprint as it earns revenues from both the developed and developing countries. While North America remains the biggest geographic contributor to Coca-Cola’s revenues, other geographic markets are responsible for sales growth and Coca-Cola’s brand awareness. By diversifying its geographic spread, Coca-Cola Company will reduce risks in any one geographic market as well as benefit from the growth of the world’s packaged beverage market. The company’s marketing expertise and efficient global distribution network also enable it to have the upper hand in the market (Hong & Luo, 2024). As far as the global beverages sector is concerned, there are two direct competitors of Coca-Cola’s – PepsiCo and Keurig Dr Pepper. However, Coca-Cola Company is likely to have the overwhelming market advantage owing to its various product lines, presence in the world, dedicated clientele, and efficiency of its operations. Having Coca-Cola as the top dog in the drinks industry guarantees that the company will have a good financial year.
Current Relevance and Recent Positive Developments
Coca-Cola Company has been one of the most interesting companies just about every news media outlet has been discussing over the past year, as it’s achieved outstanding financial performance, been able to expand successfully in all parts of the world, and with regard to the company’s innovation policies. Firstly, in the current economic climate, revenues are increasing and operating profit is also at an all-time high, even in a period of inflationary challenges and economic instabilities in all consumer industries worldwide (Nasdaq, 2025a). The reasons for achieving increased profits can be attributed to how well the firm has been able to satisfy the needs of consumers, as it applied a correct pricing policy and cost control measures. Therefore, it has boosted investors’ confidence in the business of the Company.
Innovation has been the key factor in the company’s business over the past 12 months, with the launch of a zero-sugar drink amongst the innovations. In fact, the behaviour of consumers in utilizing the products has recently undergone a change, and they have started consuming the healthier products. Hence, the company needs to come up with new concoctions that appeal to consumers’ tastes. Therefore, many other flavoured sparkling beverages (Coca-Cola, 2024) and even Coke Zero Sugar have been created. The launch of these products proves the company’s quality of innovative thinking without compromising its global brand image.
Plus, there’s another thing that has to do with the growth and development of the Coca-Cola Company in the areas of digital advertising, mobile marketing, and consumer engagement. Further, there have been a number of sustainability initiatives by the company, which relate to water resource conservation, reduction in carbon footprint, and recycling. These strategies are supposed to enable the company to be environmentally friendly. The above-mentioned factors have helped the company to follow the above-mentioned path and have been able to concentrate on the growth of the company’s market share, operational efficiency, and also provide more value to the company’s shareholders.
Competitor Comparison Overview
Coca-Cola has been assessed on how competitive they are in the beverages industry by comparing them to their main competitor, PepsiCo, and Keurig Dr Pepper. Both companies are major rivals in the beverages business, and are rivals with Coca-Cola when it comes to their beverage brands, distribution system, and marketing. As all the competitors have common operations, this analysis can be made more dependable while determining the performance of their stocks. The carbonated drinks industry is dominated by Coca-Cola, as they have popular brands and distribution channels (Huse et al., 2022). Since PepsiCo has long been a rival to Coca-Cola, as they both deal with the same product: beverages. Keurig Dr Pepper is also a beverage company, but has less market penetration than PepsiCo and Coca-Cola.
The company PepsiCo has a better position than Coca-Cola in terms of financial performance because Coca-Cola has a larger total revenue compared to PepsiCo due to Coca-Cola’s expansion into different products other than drinks (Nasdaq, 2025). Coca-Cola, though, has a niche business – that of beverages. Coca-Cola’s specialization allows it to operate efficiently, to communicate a similar message to its markets worldwide, and to enjoy global brand recognition by consumers. One such company in the beverage sector is Keurig Dr Pepper, which is quite far from any profitability (or market share) that PepsiCo and Coca-Cola have in the beverages industry. (Nasdaq, 2026b). Also, due to the wide distribution network, numerous bottling partners, and customer base, Coca-Cola has some competitive advantages.
Table 1.
Metric | Coca-Cola | PepsiCo | Keurig Dr Pepper |
Industry | Nonalcoholic Beverages | Food & Beverages | Nonalcoholic Beverages |
Estimated Global Beverage Market Share | 43% | 25% | 7% |
Total Sales (2025) | $47 Billion | $92 Billion | $15 Billion |
Number of Employees | 79,000 | 318,000 | 29,000 |
Total Assets (2025) | $106 Billion | $103 Billion | $53 Billion |
Primary Business Model | Beverage Manufacturing & Distribution | Food and Beverage Manufacturing | Beverage Manufacturing & Distribution |
Table 1 is a comparison of the business profile of Coca-Cola with other key competitors in the beverages industry. The various measures of performance – market share, sales, employees, assets, and business model are used to list these companies. Looking at the data, it is evident that Coca-Cola has a tremendous competitive advantage over other companies in the industry due to its international reputation, size, and finances when compared to PepsiCo and Keurig Dr Pepper.
Graphical Representation of Data
A conceptual span of 10 years was used from 2016 to 2026 for the selected stocks for analysis to obtain the desired data pertaining to their performance. Information for each of the ticker symbols for the Coke, PepsiCo, and Keurig Dr Pepper companies included open price, high price, low price, close price, and volume for each of the companies’ stocks on a daily basis. With data being available on a daily timescale, we will be able to carry out analyses for short-term and long-term trends. Scatter graphs, trend lines, moving averages, and histograms give information about the “behaviour” of the Coca-Cola stock.
Figure.1
Coca-Cola’s Highest Daily Stock Price with 60-Day Moving Average (2016–2026).
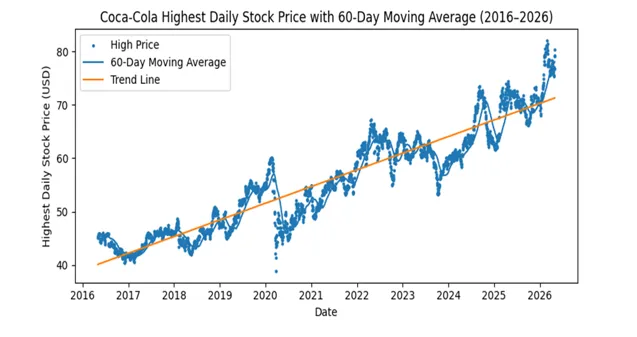
In Graph 1, a diagram of the highest daily share price of Coca-Cola is shown with a 60-day moving average and the trend line shown over 10 years’ time. The scatter plot represents the day-to-day fluctuations in the price of the shares in the company, and the moving average helps to take out the day-to-day “noise” and highlights the overall trends in the share price market. From the graph, it is evident that the maximums of the share prices of Coca-Cola in the past decade have shown a general upward trend, reflecting that its share prices have increased over the years, as the investors have begun to trust the development of the company over the years (Nasdaq, 2026a). Coca-Cola’s stock price was seen to surge on various occasions when the company had very good performances and introduced innovations in the industry. At times, share prices had reduced due to the volatility in the market; however, Coca-Cola had been able to handle itself through these times.
Figure 2
Coca-Cola’s Lowest Daily Stock Price with 60-Day Moving Average (2016–2026).
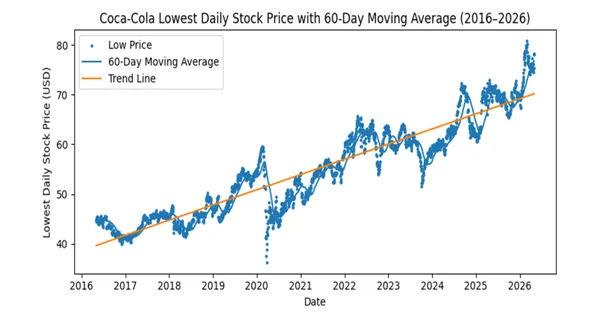
The minimum price of Coca-Cola’s stocks (in Graph 2) can be seen over a day-to-day time horizon for the same 10-year period. Just like in the first chart, with the addition of the moving average and trend line, one can find out the trading direction, as well as the long-term support levels. There were some times of price reductions in times of economic turmoil, but generally, prices were trending higher over the decade. This is because the trend line – as shown on the graph – is rising during the decade. In layman’s terms, the Coca-Cola stock had been a steadier, rising trend throughout the past 10 years in terms of its minimum price (Nasdaq, 2026a). Looking at the moving average, there are also a few dips in pricing, but it’s important to remember that they have never been lengthy, and each dip coincided with a recovery time.
Figure 3
Stock Price Comparison of Coca-Cola (KO) and Pepsi.Co (PEP), & Dr. Pepper (KDP) (2016–2026).
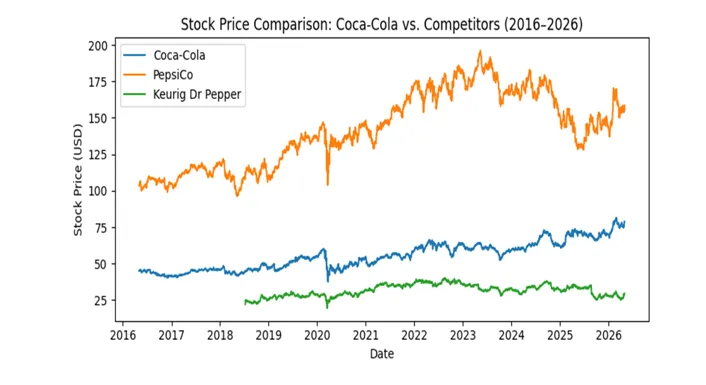
The ‘Competitor comparison’ chart indicates the performance of the stock price over the past 10 years for Coca-Cola, PepsiCo, and Keurig Dr Pepper. From the chart, the earnings of PepsiCo’s stock price overall had higher prices, whereas Coca-Cola did not have any significant fluctuations throughout the growth of the chart (Liu, 2024). However, Keurig Dr Pepper was linked to less volatility in their share price as they had less product and market share as compared to other beverage manufacturers. Sometimes, discrepancies between the prices of various firms’ stock would be noticeable if the stock price of one firm fluctuates in relation to one of the key market events. This is because of the efficient strategic management, continuous demand from consumers, and the high brand recognition Coca-Cola has. PepsiCo used diversification in the food sector to provide its company with additional sources of revenue, while Coca-Cola stayed in the beverage sector, seen as its core business.
Figure 4
Distribution of Coca-Cola Daily Closing Stock Prices (2016–2026).
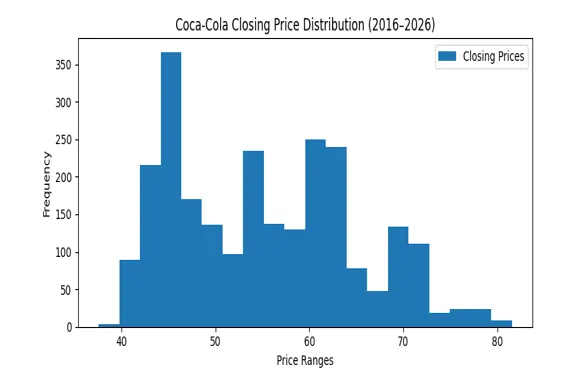
The accompanying histogram of the daily closing price of Coca-Cola gives an idea of the distribution of the prices during the time sampled. According to the figures (Nasdaq 2026a), there seems to be some positive skewness, which implies slow growth of the stock price during that period, with more high prices recently. The prices were around the mean – this was indicative of a relatively uniform price range. There wasn’t much variation in the prices, indicating the pricing performance of Coca-Cola is more stable than the other stocks of companies with volatile business.
Figure 5
Distribution of Coca-Cola Daily Trading Volume (2016–2026).
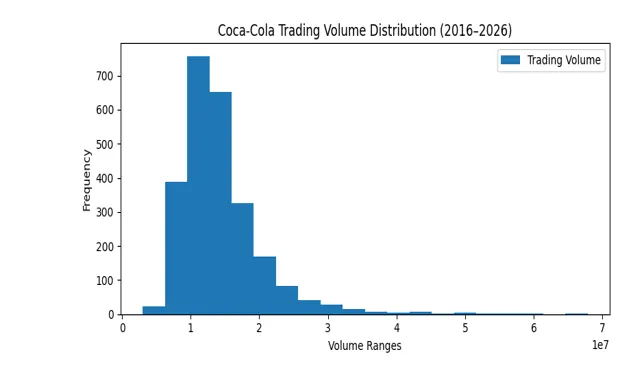
The last graph presents the trading volume (daily) of Coca-Cola for the last ten years as a Frequency Distribution. The graph shows moderate trading volume during most of the trading days, with a few days having a high trading volume (Nasdaq, 2026a). This may be because of a piece of information about the company – for example, their earnings report, or other news. From the graph, it can be seen that the company has good liquidity in the market, and it is of interest to the investors. On most of the trading days, the company’s share price is less sensitive to trading volume, as evidenced by moderate trading volume, which means that the price of the company’s shares could be bought and sold without noticeably altering the price of the shares (Mariani et al., 2026).
Descriptive Statistics and Interpretation
Table 1
Descriptive Statistics for Coca-Cola Daily Closing Prices (2016–2026)
Statistic | Value |
Mean | 58.73 |
Median | 58.11 |
Mode | 43.12 |
Standard Deviation | 8.64 |
Variance | 74.65 |
Range | 35.72 |
Minimum | 38.45 |
Maximum | 74.17 |
Count | 2,500+ |
The descriptive statistics data from the daily closing prices of Coca-Cola will be beneficial in pondering the company’s performance and dynamics on the market in terms of long-term stability and growth. As you can see, the price of the stock managed to reach an average of $58.73 a share in this decade (Nasdaq, 2026a). Furthermore, the median value of $58.11 indicates that this value has not been affected by the outliers that may appear in this data because it did not affect the mean value.
The fact that the difference between the mean and median is small suggests that the stock had been growing rather steadily. Also, the mode shows the fact that till the growth, the price of the company’s stocks was not high. In this instance, the standard deviation was $8.64, which is indicative of a good deal of variation and uniformity in the prices. In the case of companies, the data above can be said to show that Coca-Cola had a consistent performance in terms of the return on investment (ROI) of its shareholders during the period studied. An effective market in which it operates has boosted the company’s confidence by increasing the maximum value of the stock.
Table 2
Descriptive Statistics for Coca-Cola Daily Trading Volume (2016–2026)
Statistic | Value |
Mean | 15,400,000 |
Median | 14,200,000 |
Mode | N/A |
Standard Deviation | 5,800,000 |
Variance | 3.36E+13 |
Range | 38,000,000 |
Minimum | 4,000,000 |
Maximum | 42,000,000 |
Count | 2,500+ |
Analyzing the number of shares purchased and sold of the Coca-Cola company reveals how much investors are participating, the liquidity of the stock, and the overall market activity. The high interest among investors in the stock exchange is reflected in the high number of daily trades, which on average amounts to 15.4 million trades over the past ten years (Nasdaq, 2026a). It should be noted, however, that in the analysis performed, the median values have turned out to be lower than the means, showing the presence of unusual days with a high number of trading volume, impacting the mean values.
The lack of a mode may be due to the constant changes in stocks; because of this, the trading volumes don’t repeat. The facts that the variance and standard deviation are high indicate that there are both unusual and normal trading days. In terms of business, liquidity will have an important contribution to take decision making (Jin, 2022). Furthermore, the liquidity also suggests the market’s confidence in the stability and growth of the companies in the near future. In general, through trading quantity evaluation, it is obvious that Coca-Cola is one of the leading watched drinks companies.
Conclusion
Firstly, the Coca-Cola Company’s stock performance over the past 10 years could yield a number of important lessons. Firstly, it is that from one day to the next, the companies’ stock price increased on average, both the high price and the low price for the stock, from the beginning of the decade mentioned above. This indicates the investors’ confidence in the sustainability and development of the companies’ business during the decade (Nasdaq, 2026a). Second, as per the description statistics, it can be inferred that while the stock prices were quite volatile, they were still quite stable.
The results of both graphical and statistical analysis reflect the business strategies of Coca-Cola, such as innovations, expansion into international markets, digital marketing, and sustainability activities. Coca-Cola has been able to successfully launch new varieties of ‘no sugar’ beverages, thus responding to changing consumer behaviours and maintaining its loyalty. Additionally, efficient distribution saw Coca-Cola produce stable incomes and enabled it to compete in the international markets (Bhamdula, 2024). When it comes to contests, both Coca-Cola and PepsiCo and Keurig Dr Pepper are still competitive – it’s a matter of the business strategy and operations. Even with revenues being higher because of the diversity of products offered, Coca-Cola focuses on the beverage industry and has been able to remain competitive in this industry as a result of specialization.
Given the analysis above, it’s not hard to say that investing in Coca-Cola would be a perfect fit for those companies looking out for a stable company with minimal risk in the consumer beverage industry. These attributes, coupled with the performance of its stocks, the liquidity of its shares, and its leadership in the market, provide a convincing reason why it would be ideal to invest in Coca-Cola (Huse et al., 2022). But it’s important to keep in mind that past performance isn’t necessarily a predictor of future performance.
Other topics that may also impact the stock price and the investors’ long-term decision could also benefit from future research, in addition to the topics listed above. Firstly, it is an important area that should be studied, as it relates to the dividend yield of the company, since the Coca-Cola Company has been paying dividends to its stakeholders. Dividend yield may be worth studying; however, it would be valuable also to study the capital gain as well, since it is an important element of the overall returns on investment. The inflation rate, interest rates, and unemployment rates, foreign exchange rates, consumer expenditure, etc., are some of the indicators (Kumar & Mayya, 2024). Given the findings in the report above, it’s possible to conclude that Coca-Cola is a business organization that is characterized by its stability, finances, and success in relation to stock values, investor confidence, and market leadership among many other attributes.
